For the Expersys TMS Dashboard
This article explains in detail how to read each screen tile in the dashboard and what each icon color means, so that users can confidently understand system behavior at a glance.
🧩 What is a Screen Monitoring Box? #
Each box in the TMS Dashboard represents one auditorium or screen. It provides a live visual overview of that screen’s playback state, device connectivity, sound condition, and active alerts.
A single tile = one complete status snapshot of a screen.
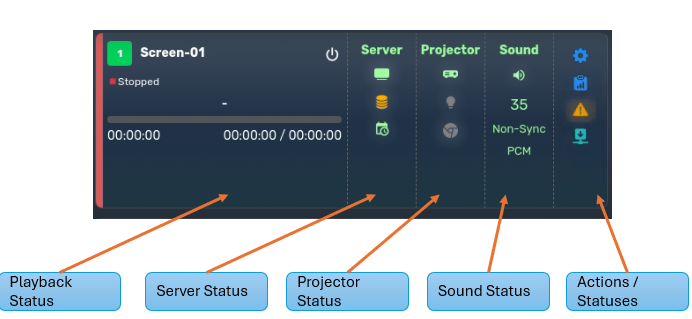
Each box is divided into 5 main columns:
| Column | What It Shows |
|---|---|
| 🎬 Playback | Current SPL, playback bar, runtime |
| 🖥 Server | Server online status, storage usage, schedule state |
| 📽 Projector | Projector connection, lamp state, shutter (dowser) |
| 🔊 Sound | Sound processor connection, format, fader level |
| ⚙️ Actions | Error icons, macros, details/logs |
🔍 Breakdown of Each Column #
1. 🎬 Playback Status #
- Top: Screen label (e.g.
Screen-04) with colored badge - Middle: Status like
Playing,Paused, orStopped - Progress Bar: Shows time progress of current SPL
- Time Info: Elapsed + Total runtime
- CPL Title: Scrolls across bottom when long
2. 🖥 Server Status #
- Server Icon: Shows if server is online
- Storage Icon: Indicates space usage
- Schedule Icon: Shows if screen follows schedule or is in manual mode
3. 📽 Projector Status #
- Projector Icon: Online or disconnected
- Lamp Icon: Shows on/off or cooling
- Shutter Icon: Open (ready) or closed
4. 🔊 Sound Status #
- Speaker Icon: Status of audio processor
- Volume Value: Current fader level (e.g.
35) - Audio Info: Format like PCM, 5.1, ATMOS
5. ⚙️ Actions / Alerts #
- ⚙️ Macro Control – Run pre-defined automation
- 📋 Screen Details – Device logs & parameters
- ⚠️ Error Alert – Error messages from Devices
- ⬇️ Ingest Progress – File transfer/Ingest ongoing into Screen
🟢 Icon Color Codes – What They Mean #
To help users quickly interpret status, icons are color-coded.
| Color | Meaning |
|---|---|
| 🟢 Green | ✅ Normal / Connected / Healthy |
| ⚪ Grey | ⚠️ Disconnected / Unknown / Offline |
| 🟡 Yellow | 🛠 Warning / Limited Function / Degraded |
| 🔴 Red | ❌ Critical Error / No response / Failure |
These colors are applied consistently across:
- Server, Projector, Sound icons
- Storage indicators
- Scheduler icons
- Error / Task icons
✅ Real Examples: #
| Icon Area | Green | Grey | Yellow | Red |
|---|---|---|---|---|
| Server | Online | Disconnected | Warning | No response |
| Storage | <85% | – | 85–95% | >95% Full |
| Lamp | On | Off | Cooling | Burnout/Error |
| Shutter | Open | Closed | – | Error |
| Sound | Active | Inactive | Format mismatch | No audio path |
| Schedule | Auto mode | – | Manual | Conflict |
| Playback | Playing | Idle | Paused | Playback failure |
🛠 Using the Dashboard Efficiently #
- 🔁 All screen tiles auto-refresh every few seconds
- 🔍 Click any icon to open related screen panel or log
- 📧 Error alerts can be emailed if user has notifications enabled
- 🧠 Use icon color + status text together to determine next action