The TMS Dashboard provides a real-time visual interface to monitor, control, and troubleshoot all screens in your cinema complex. It is designed for fast-glance usability and layered with rich controls to allow full theatre status management.
🖼️ Dashboard Layout Visual Guide #

Below is the annotated layout of the main dashboard screen:
🔹 Top Navigation Bar #
| Label | Description |
|---|---|
| Errors List from Devices | Displays total number of alerts from devices like projectors, servers, or sound processors. Clicking it opens the Errors Page. |
| Scheduling Errors | Detects sessions that are missing content, SPL links, or valid KDMs. A red number will indicate total unresolved schedule issues. |
| LMS Storage | Displays the current used percentage of the main TMS storage (LMS). Yellow if usage >85%, red if >95%. |
| Your Logo & Location | Displayed centrally for site branding and identification (e.g., “XYZ Cinemas” “Setiawalk Puchong”). |
| Dashboard Configuration | Opens screen layout preferences (e.g., 1 Per Row, 2 Per Row, 3 Per Row, 4 Per Row). In a 1920 x 1080 resolution, it is possible to display 16 screens in 1 dashboard. |
| User Control (Top Right) | Shows logged-in user and gives access to account settings or logout. |
🔹 Left Sidebar Navigation #
| Icon | Description |
|---|---|
| ☰ Hide / Show Menu | Collapses or expands the sidebar. Useful on smaller displays. |
| 🧭 Navigation Shortcuts | Switch between dashboard, schedule, ingest, macro, and more. Sidebar icons are always visible for quick access. |
🔹 Screen Monitoring Grid (Tile View) #
Each auditorium appears as a tile with five major columns:
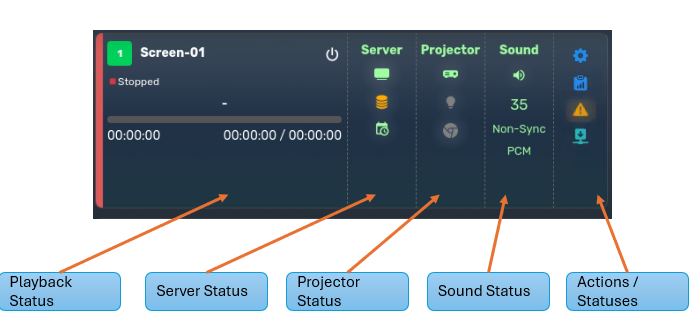
| Section | Description |
|---|---|
| Playback Status | Shows the SPL currently playing or idle status. Playback progress bar is included. |
| Server Status | Real-time server condition, storage usage, and scheduling mode. |
| Projector Status | Indicates projector online state, lamp, and dowser (shutter) state. |
| Sound Status | Displays sound processor state, fader level, and audio format (e.g., PCM, 5.1, ATMOS). |
| Actions & Statuses | Provides quick access to macros, details, and displays alert icons when errors are detected or ingest progress. |
🔸 Icon Color Codes #
Each icon in the Server, Projector, and Sound columns uses color indicators for immediate visual diagnosis:
| Color | Meaning |
|---|---|
| 🟢 Green | Normal / Operational |
| ⚪ Grey | Offline / No connection |
| 🟡 Yellow | Warning or degraded state |
| 🔴 Red | Critical failure or error condition |
These apply to:
- Server connection
- Projector status
- Lamp status
- Storage usage
- Sound processor status
- Error indicators in the Action column
🔹 Actions / Status Column Icons #
| Icon | Function |
|---|---|
| ⚙️ Macro Button | Open automation macro execution |
| 📋 Screen Details | Show full screen log/status modal |
| ⚠️ Warning Alert | Devices error messages |
| ⬇️ Ingest Task Failure | On Going Transfer/Ingest into Screen |
✅ Summary #
The TMS Dashboard is your central control panel — offering live feedback and one-click access to all key auditorium functions. Each tile reflects:
- Current playback
- Health of connected equipment
- Scheduling consistency
- Alerts and recommended actions
By using this layout, operators can monitor and act across 16+ screens with ease, while maintaining awareness of upcoming risks or performance issues.
If you have any questions please contact our support team.